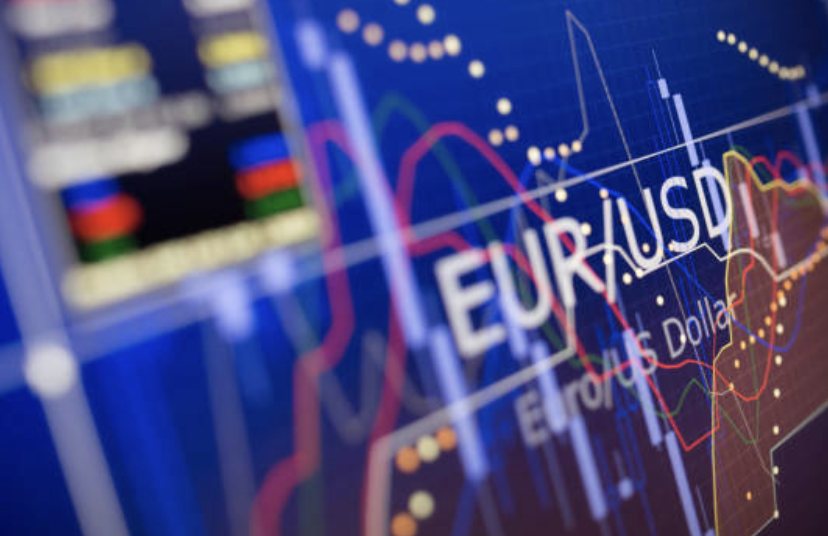
• English
  • 简体中文
  • 繁體中文
  • Tiếng Việt
  • ไทย
  • Indonesia
Subscribe
Real-time News
Futures News, October 27th. Economies.com analysts latest view today: International spot gold prices have fallen in recent intraday trading, under pressure from continued movement below the 50-day exponential moving average (EMA50), reducing the likelihood of a near-term rebound. This trend reinforces the dominance of the bearish correction trend, limiting attempts by international spot gold to resume its upward trajectory. Meanwhile, the relative strength index (RSI) formed a death cross after breaking out of its previously oversold condition, exacerbating downward pressure on prices and paving the way for further declines in subsequent trading.According to Hong Kong Stock Exchange documents: Xiamen Haichen Energy Storage Technology Co., Ltd. submitted an application for listing to the Hong Kong Stock Exchange.Futures News, October 27th. Economies.com analysts latest view today: WTI crude oil futures fluctuated in the previous trading day, attempting to build the necessary upward momentum to break through the strong resistance at $61.75. Oil prices are currently trading above the 50-day exponential moving average (EMA50), indicating the dominance of a steep bullish corrective wave and confirming the strength of the current trend. The relative strength index has reached excessively oversold territory relative to price action, providing additional support for potential upside in subsequent trading. If oil prices can maintain above the key support level, the market is more inclined to believe that the bullish momentum will continue.On October 27th, CICC published a research report stating that Topbo (06110.HK)s first-half fiscal year 2026 results were in line with expectations, with revenue down 6% year-on-year and net profit down 10%. An interim dividend of RMB 0.13 was declared, resulting in a payout ratio of approximately 102%. The bank maintained its EPS forecasts for Topbo at RMB 0.21 and RMB 0.26 for fiscal years 2026 and 2027, respectively, and maintained its "Outperform" rating, raising its target price by 23% to HK$4.17.Brazilian President Lula: We have to fight for what we want.

The US Dollar Index (DXY) clings to 98.000 despite a gloomy mood and a need for safe havens

Larissa Barlow

Apr 01, 2022 10:11

  • The US Dollar Index closed March with a 1.65% rise, boosted by a bearish market attitude.

  • A protracted confrontation between Russia and Ukraine could benefit safe-haven assets.

  • Money market futures have priced in a 69.9 percent possibility of the Fed raising interest rates by 50 basis points at its May meeting.

  • DXY Price Prediction: The bias is upward, but a breach below 97.802 might allow for additional losses.


The US Dollar Index, usually known as DXY, is a measure of the value of the US dollar versus a basket of six currencies. It closed March positively, with a monthly gain of 1.65 percent, its best since November of 2021. At the time of writing, the US Dollar Index was at 98.348.


On the last trading day of March, the market was in a bad mood. Failure to reach a significant settlement in the Russia-Ukraine crisis leaves investors on edge, enhancing the dollar's prospects. Furthermore, money market futures forecast the Federal Reserve to raise interest rates by 50 basis points at its May and June meetings, keeping the US dollar on the rise.


The US Personal Consumption Expenditure (PCE), the Federal Reserve's preferred gauge of inflation, increased by 6.4 percent year on year in February, exceeding the previous 6 percent reading. Meanwhile, Core PCE, which excludes volatile items, increased by 5.4 percent year on year, exceeding the 5.5 percent predicted by analysts.


Simultaneously, the US Department of Labor released Initial Jobless Claims for the week ending March 26. The final result was 202K, which was more than the 197K predicted.

DXY Price Prediction: Technical Outlook

The US Dollar Index remains bullish, but is consolidating in the 97.800-99.418 zone. The 50-day and 200-day moving averages (DMAs) remain below the price with an upward slope, indicating that the uptrend is still in place.


On the upside, the DXY's first resistance level is 99.000. If the latter is breached, the YTD high of 99.418 will be revealed, followed by the crucial 100.00 barrier.


The DXY first support, on the other hand, would be 98.000. A definitive breach would reveal 97.802, which, if broken, would clear the road to 96.000, but it would encounter some obstacles on the way down. The 50-DMA at 97.196 would be the next level of support, followed by 96.000.


image.png