• English
  • 简体中文
  • 繁體中文
  • Tiếng Việt
  • ไทย
  • Indonesia
Subscribe
Real-time News
Counterpoint: Apples iPhone sales in China fell 6% from July to August.According to the Wall Street Journal: Ford Motor (FN) further cuts 1,000 jobs in Germany due to continued weak demand for electric vehicles.The European Parliaments head of metals will visit Kyiv, MEPs said.September 17th news: On September 17th local time, Krasnodar Airport in southern Russia received the first flight since its suspension of operations. This is also the first time the airport has resumed formal operations since its closure since the outbreak of the Russia-Ukraine conflict in February 2022.The number of rate cuts this year is expected to increase. 1. JPMorgan Chase: The updated dot plot indicates room for three rate cuts this year, one more than the June dot plot. 2. Deutsche Bank: The updated dot plot median may indicate a total of 75 basis points of rate cuts in 2025, 25 basis points more than the June forecast. 3. Barclays: The dot plot indicates three rate cuts this year, one each in 2026 and 2027, while the median long-term rate forecast remains unchanged at 3.0%. 4. Bank of Montreal: The median rate forecast for the end of 2025 is expected to be lowered to reflect the possibility of 25 basis point cuts at both the October and December meetings. The dot plot remains unchanged from June. 1. Pepperstone: The Federal Reserve is likely to disappoint market expectations. The dot plot median is likely to remain unchanged, still indicating only a cumulative rate cut of 50 basis points this year. 2. UBS: The dot plot will show two rate cuts this year, while the market expects closer to three. Participants economic outlook forecasts will also be in focus. 3. Bank of America: With macroeconomic forecasts largely unchanged, the median Fed rate forecast for 2025 will continue to indicate a 50 basis point cut, despite a downward shift in the overall dot plot. 4. Goldman Sachs: We expect the updated dot plot to show two rate cuts this year, to 3.875%. While the Fed may currently be planning three consecutive rate cuts this year, it may decide that forcing this into the dot plot is unnecessary. 5. Morgan Stanley: We expect the median dot plot to still show two rate cuts this year, but actual economic data may push the Fed to continue cutting rates throughout the rest of the year, extending this round of cuts into January. Other Views: 1. Citigroup: The updated dot plot is likely to indicate two to three rate cuts this year, and the median rate forecast for 2026 may also be revised downward.

Under the international gold price, support is at $1750

Oct 26, 2021 11:02

On Wednesday (October 13), international gold prices strengthened, but the increase was modest. Investors are waiting for US inflation data and the minutes of the Fed’s September policy meeting to find clues as to when the central bank will begin withdrawing its massive stimulus measures. The price of gold remains bearish in the short-term, with support at $1750 below.

At GMT+8 13:39, spot gold rose by 0.12% to US$1762.11 per ounce; the main COMEX gold contract rose by 0.17% to US$1762.3 per ounce; the US dollar index fell by 0.16% to 94.366.


Three Fed policymakers said on Tuesday (October 12) that the economy has recovered enough for the central bank to begin withdrawing support policies during the crisis. This strengthens the Fed’s expectation that the Fed will start reducing monthly bond purchases as soon as next month. Central bank cuts in stimulus measures and interest rate hikes tend to push up government bond yields and increase the opportunity cost of holding gold.

The number of job vacancies in the United States decreased in August, but still exceeded 10 million, which is a very high level. Due to the tight labor supply, the number of voluntary resignations surged to a record high in August, hindering employment growth.

White House officials warned that during this Christmas period, Americans may face rising prices and empty shelves. Officials are currently busy alleviating the global supply bottleneck that has plagued US ports, roads and railroads.

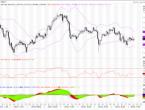
On the daily chart, the price of gold has started a three-wave downward trend from US$1,781, and the support below looks to the 38.2% target of US$1738. Wave 3 is a sub-wave of the downward (3) wave that started at $1834. (3) Lang's 61.8% target is at $1688. (3) Wave is a sub-wave of the downward ((Y)) wave that started from 1917 USD. The ((Y)) wave belongs to the adjusted IV wave that started at $2,075.

On the hourly chart, the price of gold has started a downward wave ((iii)) trend from US$1769. It is expected to fall below the 38.2% target of US$1757, and further drop the 50% target of US$1750. ((iii)) Wave is a sub-wave of Wave 3.