• English
  • 简体中文
  • 繁體中文
  • Tiếng Việt
  • ไทย
  • Indonesia
Subscribe
Real-time News
On January 8th, it was learned from the Hangzhou Municipal Bureau of Economy and Information Technology that the Geely 9X, equipped with the Qianli Haohan H9 solution, has recently been jointly confirmed by the Hangzhou Municipal Bureau of Economy and Information Technology, the Municipal Public Security Bureau, and the Municipal Transportation Bureau to obtain a Level 3 autonomous driving road test license covering 9,224 square kilometers of Hangzhou (including over 1,500 kilometers of two-way expressways). The license was issued by Geely Automobile and is currently the largest and longest Level 3 autonomous driving test license in China, allowing for comprehensive access to traffic datasets from over 7,000 intersections in Hangzhou, enabling all-round, multi-level, and wide-coverage verification of autonomous driving capabilities throughout the city.On January 8th, Alibaba Cloud released a multimodal interaction development kit. The kit integrates three general-purpose basic models: Qianwen, Wanxiang, and Bailing, and comes pre-installed with more than ten Agent and MCP tools for fields such as life and leisure and work efficiency. It can not only hear and see, but also think and interact with the physical world. It can be applied to hardware devices such as AI glasses, learning machines, companion toys, and intelligent robots.On January 8th, Reserve Bank of Australia (RBA) Deputy Governor Hauser stated on Thursday that the RBA is taking a one- to two-year medium-term perspective when assessing inflation, rather than reacting to a single data release, indicating that policymakers will remain cautious about future interest rate adjustments. Hauser said that inflation above 3% is "too high," and that policymakers will await the full quarterly inflation report to be released on January 28th to form their judgment on consumer price trends. He also stated that Australians may have already seen the final rate cut in this easing cycle. Official data released yesterday showed that Australian inflation slowed in November, but both headline and core inflation indicators remained above the RBAs target range of 2% to 3%. Hauser said the results were "broadly in line with expectations." Following his remarks, traders lowered their bets on a May rate hike to 80%, after the market had earlier fully priced in a rate hike. The more policy-sensitive three-year government bond rose, pushing yields lower.The Saudi-led coalition said that the chairman of Yemens Southern Transitional Council, Zubaidi, boarded a plane bound for Mogadishu under the supervision of UAE officials.According to foreign media reports on January 8th, maritime shipping data is projected to surpass the 2025 forecast threshold, with global 20-foot equivalent unit (TEU) throughput exceeding one billion for the first time. Shipping intelligence platform Linerlytica stated that this milestone demonstrates the overall resilience of global trade flows, even in the face of widespread economic headwinds, geopolitical tensions, and tariff uncertainties. With continued demand growth, the global container fleet is expected to continue expanding, reflecting industry confidence in flexible response strategies—such as circumnavigating the Cape of Good Hope rather than choosing the shorter east-west routes through the Suez Canal. While slower speeds last year sparked controversy—especially during the freight rate crash—consultants point out that the overall lack of idle capacity indicates that capacity is being actively utilized. According to Linerlytica, global newbuilding orders have surged to approximately 10.4 million TEUs. This signifies a large-scale reserve of new capacity and represents the highest order ratio since the 2010s—approximately 31.7% of the existing fleet size. However, major retailers such as New Zealands UFL Group are concerned that the rapid expansion of the fleet could lead to supply growth exceeding demand in the coming years, resulting in overcapacity and the resulting pricing pressures that will continue until 2030.

The Ascending Triangle: What is it & How to Trade it?

Drake Hampton

Mar 24, 2022 17:32

The ascending triangle, sometimes known as the 'rising triangle,' is a popular mid-trend continuation pattern. Traders predict that the market will continue in the direction of the wider trend and therefore build trading setups. 

Learn to Trade the Ascending Triangle Pattern: Main Talking Points

  • An ascending triangle is defined as

  • Recognize an ascending triangle pattern on the FX market charts

  • The ascending triangle trading strategy

  • The ascending triangle's advantages and limitations

  • Utilize our interactive Currency Trading Patterns quiz to assess your understanding of forex patterns. 

What Is An Ascending Triangle?

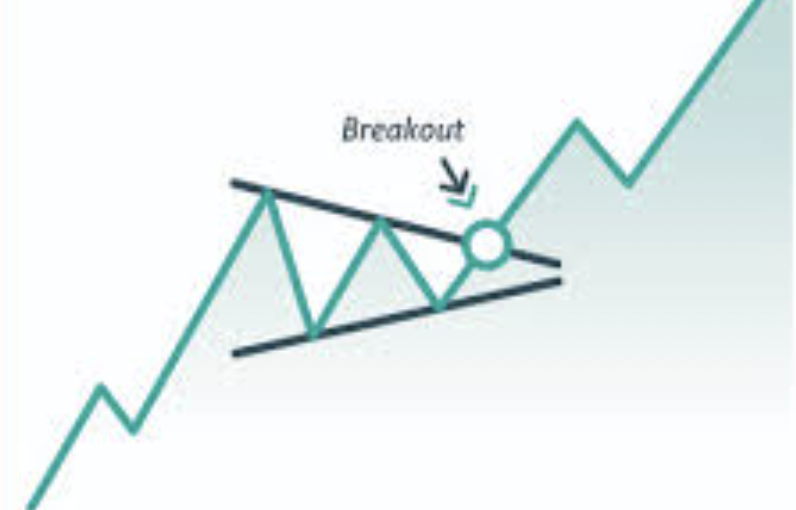
The ascending triangle pattern is a bullish continuation pattern defined by a rising lower trendline and a flat upper trendline acting as support. As price continues to hit greater lows, this pattern shows that buyers are more aggressive than sellers. When price breaks out of the triangle in the direction of the broader trend, the pattern is complete.


image.png 

The Ascending Triangle as a Bottoming Pattern

The ascending triangle's position in regard to the trend dictates whether a reversal or continuation of the trend is more likely. At the bottom of a downtrend, the ascending triangle may form, indicating that the downward momentum is waning before potentially changing direction. As a result, the position of the pattern is critical.  

How To Identify An Ascending Triangle Pattern On Forex Charts

Once traders understand what to look for, the ascending triangle is pretty straightforward to see on forex charts.


Prior to the emergence of the ascending triangle, the market must be in an uptrend. This is critical and emphasizes the importance of traders not merely trading the ascending triangle pattern everytime it arises.


Consolidation: As the market enters the consolidation period, the rising triangle begins to take shape.


A rising lower trendline may be formed by connecting the lows while the market is consolidating. This ascending trendline indicates that buyers are gradually driving the price upward — providing more evidence for a bullish trading inclination.


Upper trendline is flat: The upper trendline functions as a barrier. Price frequently approaches and bounces off of this level until the breakout happens.


After price breaks decisively above the upper trendline, traders will look for confirmation of the pattern in the form of further upward momentum.


image.png

Ascending Triangle Measuring Technique

The ascending triangle pattern incorporates a built-in measurement mechanism that may be used to estimate possible take profit objectives.


Traders can calculate the distance between the start of the pattern, at the lowest point of the rising trendline, and the flat support line for the ascending triangle. Later on, this identical distance can be transferred, beginning at the breakout point and finishing at the probable take profit level.


The picture below demonstrates how the distance between A and B might be projected further up, from C to D, to project a probable take profit level.


image.png 

How To Trade The Ascending Triangle 

When trading the ascending triangle, traders must first determine the uptrend, as seen in the USD/CAD chart below. Following that, when the forex candlesticks begin to consolidate, the ascending triangle appears. Once the triangle formed, the measuring approach may be utilized as traders await the breakout.


After observing a solid break over resistance, traders may open a long position, putting a stop loss at the previous swing low and establishing a take profit goal consistent with the measurement approach.


image.png 

Advantages And Limitations Of The Ascending Triangle

When examining probable trend continuations, the ascending triangle is a very useful pattern. It does, however, have some drawbacks, which traders should be aware of. 


image.png