Multi-timeframe analysis, as well as comparative analysis, provide several advantages. Shorter-term time frames are often used by traders to begin trades and put stops. The BIG money, on the other hand, comes from gleaning information from longer-term charts. Long term is defined as a monthly or weekly time frame, whilst short term is defined as a daily or 4-hour time period.
We may undertake a comparison study by comparing various time periods or by looking at how our market trades in comparison to another highly connected market.
We felt it would be appropriate to compare the current chart of the SPY to the S&P 500 index over the 2002-2009 period, given the high level of interest in equities among our subscribers. From 2002 to 2007, the S&P 500 weekly chart had a solid bull market with numerous purchase points.
The S&P 500 reached its 2007 high at a 2.0 or 200 percent extension of its 2002 high versus low. The stock was then sold off for a bit more than -20% after roughly 5-months. The S&P 500 surged for many weeks after hitting the important -20 percent psychological end-of-bull-market level, eventually reaching its 1.618 overhead barrier. The S&P 500 From peak to trough, it took 17–18 months to reach its lowest point.
Spy Before staging a Dead-cat Bounce, you're vulnerable to another -8 percent drop!
From its top in 2022, the SPY is down around -12 to -13 percent. It's possible that the SPY may drop another 8% or perhaps -20% before staging a rebound in late summer or early autumn. If this scenario comes out, we could expect a big collapse or bear market in the fourth quarter of 2022, which might go until 2023 and beyond.
The S&P 500 index peaked in 2007 at 2.0, representing 200 percent of its last significant high-low swing low. The SPY's 2022 peak was likewise 2.1618, or 200 percent of its Covid high-low swing low.
The SPY has the ability to drop -20% from its high before launching a short recovery to a lower distribution top.
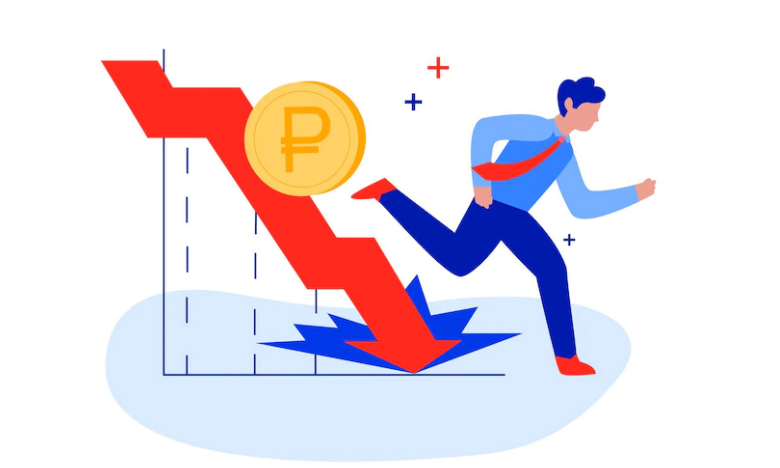
The value of the US dollar continues to rise.
We can clearly see that large economies (the United States, the United Kingdom, and Japan) are not immune to global deleveraging and inflation. Investors have been flocking to the US Dollar for protection, which might lead to a bigger and deeper selloff in US markets. Corporate earnings for US multinationals will begin to dwindle as the USD strengthens.
Traders must understand where chances exist and how to leverage this information into profits, especially in times like these. At www.TheTechnicalTraders.com, we condense price action into technical methods and modeling systems as part of our services. These help us recognize when there are opportunities in the US stock market and particular sector ETFs. Our primary goal is to safeguard our wealth while recognizing profitable risk-reward possibilities in new and developing trends.
Berkshire Hathaway is a canary in the coal mine.
Miners used to bring canaries into coal mines about 1911 to give them an early notice of danger. Traders in the financial markets also use this term or comparison. Our canary or canaries would simply be a market or stock that might indicate a problem with the whole market or that the global equity markets are transitioning from bull to bear territory.
Berkshire Hathaway
Warren Buffett's BRK.A (NYSE) is a diversified holding company with businesses in insurance, freight rail transportation, energy production and distribution, services, manufacturing, retailing, banking, and other industries. The stock market, in our instance, is a strong candidate for "a canary in the coal mine."
Berkshire Hathaway is down around 9% from its top in 2022, but is still up 10% year to far. For a few days, BRK's stock price increased by 200 percent as its shares went above 2.618 and 2.666 before falling. BRK rallied 2 years and 6 days from trough to peak from its Covid low on March 23, 2020 to its 2022 high on March 29, 2022.
If BRK drops 20% from its top or loses all of its 2022 gains in the stock price, we should be prepared to sell the rebound that follows if we haven't already. TTT subscribers are already in cash and are waiting for trading instructions on a few alternative or inverted ETFs.
Understanding the Value of Money Is a Game-Changer
As we follow global money movement, our models continuously track price behavior in a variety of markets and asset types. As fresh information regarding trends or changes in trends is generated by our models, we will quickly disseminate these signals to our subscribers and those on our trading weekly email list.
When it comes to trading, it's not just about knowing when to purchase or sell stocks or commodities. When it comes to being a consistently effective trader, money and risk management are crucial. Stop-loss orders, when used correctly, enable to protect your investment money and allow traders to manage their portfolios according to their specified risk boundaries. Scaling out of positions by taking gains and adjusting stop-loss orders to breakeven may also help a trader succeed.
What are some strategies that might assist you in navigating current market trends?
Learn how we employ unique methods to find strategic entry and exit locations for trades by understanding market cycles, set-ups, and price target levels in different sectors. We foresee extremely big price fluctuations in the US stock market and other asset classes throughout the world during the next 12 to 24 months.
We think the markets have entered a revaluation period as global traders strive to discover the next significant trends, moving away from the sustained central bank support rally. As traders and investors seek safe havens in Metals and other safe havens, precious metals will likely begin to operate as a good hedge.