By averaging the candlesticks themselves, Heikin Ashi candles make it straightforward to include averaging into price movement research. This gives candles a smoother, more continuous appearance, which makes them easier to visualize trends.
The open, close, high, and low prices are used to make both standard candlesticks and Heikin-Ashi candles. The primary distinction between them is that Heikin-Ashi candles are an averaged version of regular candlesticks that incorporates data from the preceding bar in order to determine the open price of the current candle.
Because the color coding of Heikin Ashi candles varies per platform, rather than giving a uniform method, the following should be used to determine which one is being utilized:
Open your trading platform and add Heikin Ashi candlesticks to your chart (if you don't already have a trading platform, browse our broker directory to locate one that meets your needs).
Recognize an obvious upward trend and take notice of the color or kind of candle utilized (it can be empty candles, green candles, blue candles)
Recognize an obvious downward trend and take notice of the color utilized (it can be red candles, black candles, etc)
Now you're aware of the color scheme used by your trading program to depict Heikin-Ashi candlesticks.
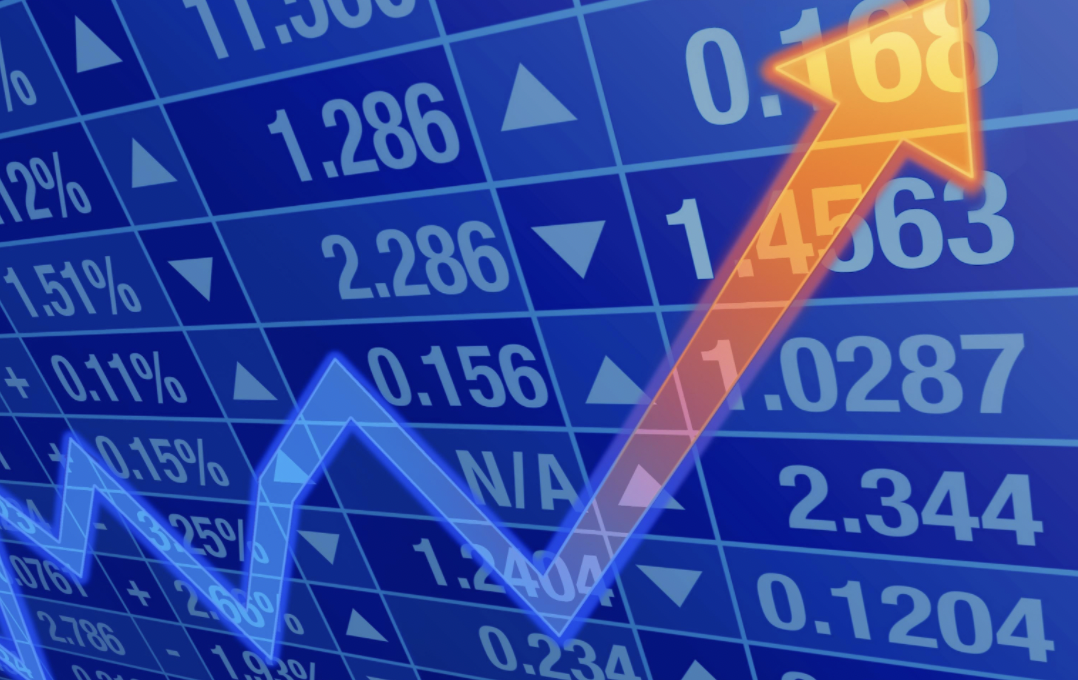
Heikin Ashi Candles Introduction
Heikin Ashi, often written Heiken-Ashi, is a Japanese term that translates as "average bar." When trading securities, the Heikin-Ashi approach can be used in conjunction with candlestick charts to identify market patterns and forecast future prices. It's beneficial for improving the readability of candlestick charts and trend analysis. For example, traders can use Heikin-Ashi charts to determine when to remain in transactions during the continuation of a trend but exit when the trend pauses or reverses. Because the majority of profits are produced while markets are moving, properly anticipating trends is critical.
Heikin-Ashi Candlesticks are a direct descendant of Japanese candlesticks. Heikin-Ashi Candlesticks construct a combination candlestick by combining the open-close data from the previous period with the open-high-low-close data from the current period. The resultant candlestick eliminates some noise in order to more accurately reflect the trend. Heikin-Ashi is a price index that measures the average rate of change in prices. Heikin-Ashi Candlesticks are not used in the same way as conventional candlesticks. There are no dozens of bullish or bearish reversal patterns comprised of 1-3 candlesticks. Rather than that, these candlesticks may be utilized to highlight trending periods, possible reversal points, and traditional technical analysis patterns.
As with a simple moving average, the primary goal of a Heikin-Ashi candle is to smooth out the price volatility seen in conventional Japanese candlestick charts, which makes them an excellent tool for detecting trends.
The following is a fairly common Heikin-Ashi behavior:
Additionally, similar to traditional candlesticks, the size of each candle appears to correlate with the strength of the movement.
This behavior is not exclusive to Heikin-Ashi candles. In classic candlestick charts, a long green candle also indicates strong bullish pressure; it's an issue of not memorizing candle codes, patterns, or styles, but rather of examining them and asking yourself how a candle became so long and green.
Always keep in mind that the most effective technique to evaluate a chart is to think and attempt to make sense of the price movement using logic. Because candles lack personality and are only a visual reflection of buyers and sellers' behaviors, what we actually care about is how buyers and sellers behave. Heikin-Ashi candles, on the other hand, are an averaged depiction of this behavior.
Formula Heikin Ashi
A standard candlestick chart is made up of a succession of open-high-low-close (OHLC) candles that are separated by a time series. While the Heikin-Ashi approach is similar to candlestick charts, it employs a modified version of the close-open-high-low (COHL) formula:

How to Create a Heikin Ashi Candlestick Chart
The Heikin-Ashi chart is produced similarly to a standard candlestick chart, with the exception that the formula used to calculate each bar is different, as seen above. The user defines the time series, which can be daily, hourly, or five-minute intervals, depending on the style of chart needed. The negative days are symbolized by filled candles, while the positive days are symbolized by empty candles. The chart platform may also color these in, such that up days are white or green and down days are red or black, for example.

There are a few distinctions between the two sorts of charts, as the charts above show. Heikin-Ashi has a more refined appearance due to the fact that it is essentially taking an average of the movement. Heikin-Ashi candles tend to remain red during downtrends and green during uptrends, whereas standard candlesticks alternate colors regardless of whether the price is moving predominantly in one direction.
It's also worth noting the pricing scale. The current price displayed on a standard candlestick chart is also the current price of the asset, as it corresponds to the candlestick's closing price (or current price if the bar hasn't closed). Due to the fact that Heikin-Ashi takes an average, the current price on the candle may differ from the price at which the market is trading. As a result, many charting tools display two values on the Y-axis: one for the Heiken-Ashi computation and another for the asset's actual price.
Explanation of Heikin Ashi Candles
Heikin-Ashi Candlesticks are quite similar to standard candlesticks, but have a few significant characteristics in common. When the HA-Close is more than the HA-Open, the Heikin-Ashi candlestick is hollow; when the HA-Close is less than the HA-Open, the Heikin-Ashi candlestick is filled. This is analogous to standard candlesticks, which are filled when the close is lower than the open and hollow when the close is higher than the open.
While Heikin-Ashi candlesticks lack classic candlestick patterns, chartists can glean useful information from these charts. Over a two-day period, a lengthy hollow Heikin-Ashi candlestick indicates significant buying pressure. Absence of a lower shadow symbolizes strength as well. Over a two-day period, a lengthy, filled Heikin-Ashi candlestick indicates significant selling pressure. Additionally, the absence of an upper shadow indicates selling pressure. Over the previous two days, small Heikin-Ashi candlesticks or those with lengthy upper and lower shadows indicate hesitation. This frequently occurs when one candlestick is fully lit and the other is empty.

The chart above illustrates QQQ over a four-month period using Heikin-Ashi candlesticks. The blue arrows indicate undecided Heikin-Ashi Candlesticks generated by the intersection of two standard candlesticks of opposing hue. Indecision can occasionally herald a trend reversal. The red arrows indicate a sharp decrease, which is shown by a sequence of Heikin-Ashi candlesticks with no top shadows. This indicates that the Heikin-Ashi Open set the bar and the subsequent data points were lower. The green arrow indicates a significant progress, as shown by a sequence of Heikin-Ashi candlesticks with no lower shadows. This means that the Heikin-Ashi open indicated the low, while the remaining data points indicated a higher value.
The significance of the Heikin Ashi candlesticks
Heikin Ashi charts help traders choose when to exit a trade when the trend weakens and when to stay in and ride a strong trend.
They are a modified manner of showing data on a candlestick chart, most notably the ability to smooth out a stock's or other financial instrument's volatility, allowing traders to construct more complicated trading strategies.
Typical candlestick charts will show both the volatility of the markets during the candlestick in question and the general trend.
Heikin Ashi charts eliminate noise and smooth out price activity on a chart by displaying numbers using averages to produce something that resembles a candlestick.
The Heikin Ashi Candlesticks: How to Use Them
Utilization of Heikin Ashi As with a traditional candlestick chart, the Heikin Ashi may be used on any timescale.
You may have a few odd hourly candlesticks that are mildly positive in the context of a larger negative trend. This might contribute to the trend's appearance being a little louder than is required or desirable.
These graphs are applicable to any market. Heikin-Ashi charts are an option on the majority of charting systems.
Five major indicators help discover trends and purchasing opportunities:
A candle that is hollow or green without any lower "shadows" indicates a strong uptrend: Allow your revenues to soar!
A hollow or green candle indicates an upward trend: You may choose to increase your long position and liquidate your short position.
Candles with a tiny body and above and lower shadows suggest a shift in trend: Risk-takers may buy or sell here, while others may wait for confirmation before entering long or short positions.
When filled or red candles suggest a downturn, you may choose to increase your short position and reduce your long position.
A significant downturn is indicated by filled or red candles with no upper shadows: Maintain brevity until the trend shifts.
These signals may make it simpler to identify trends and trade opportunities than regular candlesticks do. Trends are less frequently interrupted by misleading signals and are thus easier to discern.
The chart above demonstrates how Heikin-Ashi charts may be utilized for analysis and decision-making in trading. On the left, there are lengthy red candles, and the bottom wicks are fairly little at the start of the descent. As the price continues to fall, the lower wicks lengthen, showing that the price has fallen but has now been driven back up. The purchasing pressure is beginning to mount. This is followed by a robust upward rise.
The upward movement is vigorous and does not indicate a reversal until numerous little candles form a row with shadows on either side. This demonstrates hesitation. Traders might consider the larger picture while deciding whether to go long or short.
Charts may also be used to maintain a trader's position once a trend develops. Generally, it is preferable to remain in a trade until the Heikin-Ashi candles change color. A shift in hue does not always indicate the conclusion of a trend; it might just be a halt.
Take note that when a candle has multiple long wicks in a row on one side, this might indicate that tremendous pressure is building in the marketplace. For instance, when multiple red candles with long wicks on the bottom appear, this indicates that purchasing pressure is beginning to grow.
Finally, if you observe numerous white candlesticks in a succession with extended upward wicks, this may indicate that selling pressure is beginning to manifest itself. The wick indicates that the market was going in a particular direction, but in the event of a decline, buyers were able to bring the price back up, and vice versa for an uptrend.
The majority of traders will utilize Heikin Ashi candlesticks to remain in a trade for a considerably longer period of time after it begins, refusing to adjust their position or exit until the candlestick changes color. For instance, if four red candlesticks occur and then a white candlestick appears, a trader who is short the market may decide to close their position or even go long at that moment.
Heikin Ashi's Limitations
As with any other technical analysis tool, Heikin Ashi has limits or flaws.
For instance, because candlesticks are averaged, they do not display the precise open and closing prices for a certain time period.
Second, candlesticks disguise essential price information, such as the real closing price, which many traders value.
Additionally, because these candlesticks require data from two periods, they may be insufficiently sensitive for scalpers and day traders.
Spinning Tops and Doji
As is the case with standard candlesticks, Heikin-Ashi doji and spinning tops can be utilized to forecast price reversals. A Heikin-Ashi doji or a Heikin-Ashi spinning top seems to be identical to a standard doji or spinning top. A doji is a miniature candlestick with an almost equal open and closing. There are modest above and lower shadows to indicate that there has been minimal fluctuation in the price.
Spinning tops feature a small body (open-close range) and extensive upper/lower shadows (high-low range). Despite considerable fluctuation from high to low, prices close very close to their initial point with little change. This demonstrates hesitation, which may portend a reversal.
A doji or spinning top in a downtrend should not be automatically interpreted as positive when utilizing Heikin-Ashi candlesticks. This only demonstrates hesitation inside the decline. Indecision is the first step toward reorienting oneself. However, confirmation of a directional shift (trend reversal) is necessary. Once chartists identify a doji or spinning top in a downtrend, it's important to establish a resistance level to serve as the foundation for a trend reversal.
Caterpillar (CAT) is seen below with a spinning top developing in late May. (1). Because the trend is obviously downward, a resistance level has been established to denote a reversal breakout (confirmation). CAT eventually broke through this resistance level a few days later, but the breakout was unsuccessful - a lesson that not all signals are flawless. The downturn continued, and in mid-June, CAT produced two doji. After the doji and CAT broke resistance to confirm a reversal, a resistance level was indicated.

Classic Chart Patterns
On Heikin-Ashi charts, Classic chart patterns and trend lines can also be employed. In comparison to conventional candlesticks, Heikin-Ashi Candlesticks are more likely to trend with consecutive full candlesticks and consecutive hollow (white) candlesticks. Apache (APA) fell in late October as a result of a streak of full candlesticks. In early November, the Heikin-Ashi candlesticks formed a falling wedge, and APA surged through resistance. As the stock consolidated in November, a triangular formation formed. The breakthrough to the higher signified the continuance of the larger upswing.

Final Thoughts
Heikin Ashi incorporates a smoothing technique that uses the average of the most recent move, rather than merely the high, low, open, and close. This results in a more complete "feel" for the trend, assuming there is one at all.
The candles will indicate whether or not there is genuine momentum depending on the presence or absence of wicks. If the market is on an uptrend and the candle has no wicks at the bottom, the trader can follow the trend while trailing a stop loss. This also works in reverse.
Heikin Ashi candlesticks are an excellent substitute for conventional Japanese candlestick charts. Due to their importance in recognizing market trends, these candlesticks are well-suited for day traders, scalpers, and swing traders.
Traders may use these customized candlesticks to any market and time range. If you get familiar with Heikin Ashi candlesticks, you may utilize them to assist in determining trends and trend reversals across a variety of financial markets.
Heikin-Ashi Candlesticks are a useful tool that chartists may use to filter out noise, anticipate reversals, and identify classic chart patterns. Indeed, these charts may be used to apply all facets of conventional technical analysis. Heikin-Ashi Candlesticks can be used by chartists to define support and resistance, establish trend lines, and measure retracements. Additionally, volume indicators and momentum oscillators are effective.