We'll demonstrate the appearance of the Dragonfly Doji candlestick pattern, explain its components, teach you how to analyze it, and examine its limits in this guide to understanding the Dragonfly Doji candlestick pattern.
What Is a Doji Dragonfly?

A Dragonfly Doji candlestick pattern is a sort of candlestick pattern that might indicate a possible market reversal to the downside or upside, depending on previous price movement. It occurs when the high, open, and close prices of an asset are all equal. The deep bottom shadow indicates that intense selling occurred over the candle's duration, but the fact that the price closed around the open indicates that buyers were able to absorb the selling and push the price back up.
The Dragonfly Doji is commonly understood as a bullish reversal candlestick chart pattern that appears primarily near the bottom of downtrends, which can assist traders in determining the location of support and demand. It can be used in conjunction with other indicators to indicate the possibility of an upswing. However, there are certain exceptions. If it appears near the apex of an uptrend, this does not always imply a bullish or bearish indicator. That is because the following few candles often determine the direction of the ensuing price movement.
What Does the Dragonfly Doji Look Like?
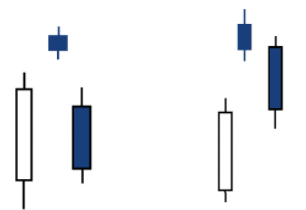
The Dragonfly Doji candle pattern is formed when the open, high, and closing prices are quite similar. Although it is uncommon, the Dragonfly can arise when all of these costs are equal. The Dragonfly Doji's most prominent feature is its extended bottom shadow.
Key Takeaways
A dragonfly doji can occur in response to either a price increase or a price decrease.
The open, high, and close prices are all same, however the period's low is much lower than the previous three. This results in the formation of a "T" shape.
The development of a dragonfly doji following a price increase indicates the possibility of a price fall. Confirmation comes in the form of a subsequent candle that closes lower.
Following a price decrease, a dragonfly doji signals that the price may increase. If the following candle rises, this confirms the trend.
Before acting on the dragonfly doji, candlestick traders often wait for the confirmation candle.
Example of a Dragonfly Doji Candle
A nice illustration of a dragonfly doji pattern is displayed below on the four-hour EUR/USD chart. As you can see, the price was in a slight decline when it opened considerably lower and then returned to its opening level.
This pattern was there, and it was followed by a strong rising trend, which took the price to 1.1830.

The second illustration shows the USD/ZAR pair in a modest downward trend as well. Three successive candles had been out. The fourth one began just below the point at where the third one ended, plummeted steeply, and finally closed near the point at which it began. After then, the couple made a small bounce.

How Does a Doji Dragonfly Form?
The Dragonfly Doji pattern appears when the price falls to a specific level but then returns to the period's open, regardless of whether you're trading on the H1, H4, D1, or any other timeframe. When bears are actively driving the price lower, this pattern appears. However, they are eroding their power and allowing bulls to seize control, to the point where the latter are reviving the price to open levels.
When the Dragonfly reaches its bottom, the bears run into solid support, and the buying pressure aids the price recovery. This indicates that a current downturn is no longer supported by broad mood and that a potential uptrend is on the horizon.
Traders often initiate long trades or settle existing short positions shortly after a Dragonfly candle. The pattern is good at identifying the support level, which may be checked again if the price begins to retrace its steps.
When the Dragonfly Doji forms at the apex of an uptrend, it can still be a positive indication indicating the continuance of the trend. However, this is not a rule. In this instance, bears sought to reverse the positive trend, but the price is likely to continue in the upward direction if they are unsuccessful.
When bulls and bears both attempt but fail to move the price during a candle session, a dragonfly doji candle forms. In other words, bears seize control of price throughout the session and drive it lower than the initial price, while bulls drive it higher and close it almost exactly at the opening price.
When this pattern can happen?
This doji pattern can occur within a range or following a significant downward trend. If it occurs during a period of range trading, it is often a hint that the price will continue within the present range.
However, if it occurs during a prolonged downward trend, it may be an indication that bears are weary and buyers are returning.
How to Trade With the Dragonfly Doji?
While the Dragonfly Doji is frequently utilized in stock trading, trading cryptocurrency using Dragonfly is not nearly as difficult. If the Dragonfly Doji is observed at the bottom of a downtrend, it can be interpreted as a strong buy signal. When the pattern appears in other contexts, it just indicates a local price rejection.
The Dragonfly Doji pattern is most frequently used in techniques that need the pattern to form towards the bottom of a bearish swing. When this basic criterion is satisfied, traders would seek the optimal time to initiate a long position, anticipating a trend reversal. Whereas those with open short positions elsewhere would seek to close them.
While the Dragonfly Doji is a pretty reliable indication, it is critical to include multiple technical indicators, including moving averages and one of the oscillators, such as Stochastic or the Relative Strength Index (RSI). The momentum indicators will reveal if the price has reached an oversold condition and is poised to recover.
Apart from the aforementioned indicators, traders would want to enter trades during periods of increased volume, which increases the Dragonfly Doji's trustworthiness.
Another key factor to examine is the extent of the lower shadow — the longer it is, the more significant the bullish signal.
Trading at the Bottom of a Downtrend
The primary scenario is to trade the Dragonfly pattern near the bottom of a downtrend. Therefore, it would be preferable if you were more interested in joining the market when this criterion is satisfied. If a Dragonfly appears after a bearish move, be prepared for a trend reversal.
However, do not rush into long positions immediately after the candle closes, as the bears may attempt to break the freshly created support repeatedly. Rather than that, it is preferable to initiate a long position once the first candle closes above the Dragonfly Doji's high.
You can place the stop loss on the long trade directly below the Dragonfly's low. Concerning the take profit, traders would set a goal equal to the pattern's size multiplied by two. If you're concerned about missing out on possible profits, you may set a trailing take profit to benefit from a longer-term surge.
Ensure that you check one of the oscillators, whether you choose the RSI or the Stochastic. If the price is in the oversold zone (RSI value less than 70% or Stochastic value less than 80%), the Dragonfly Doji indicator is considerably stronger. The signal indicates that it is more significant as the volume is increased.
In the example below, a Dragonfly pattern is not flawless, but it occurs at the bottom of a bearish trend and corresponds with Stochastic's oversold level. Indeed, it signaled the reversal of a trend.
Trading at the Top of an Uptrend
The Dragonfly Doji may appear in a positive market on rare occasions. If this occurs, it makes little sense to prepare for a trend reversal. This is primarily because the pattern might result in the continuance of the upswing. In this situation, the Dragonfly may indicate that the bullish advance has reestablished its original rhythm and is likely to continue for some time. You can initiate a long trade if the subsequent candle closes above the Dragonfly, and other technical indications also indicate a bullish advance. Nonetheless, the Dragonfly is a poor warning in this instance, and most traders would avoid the market entirely.
For instance, the trading pairs were in an upswing, with the Stochastic indicating an overbought condition. The conditions for reversing the trend were present. However, the rise resumed following a dramatic volatility caused by the Dragonfly's appearance. Bears attempted a reversal following the Dragonfly, but bulls recovered stronger. In situations like these, it would be advantageous to initiate a long position once the first candle closes over the Dragonfly.
The Benefits of the Dragonfly Doji Pattern
Limitations of a Dragonfly Doji Candle
Although the dragonfly doji is uncommon, price reversals occur frequently. As a result, the dragonfly doji is not a very accurate indication of price reversals. Even with the confirmation candlestick, the price cannot be guaranteed to continue the trend. Generally, a greater volume dragonfly doji is more trustworthy than a lesser volume dragonfly doji. Additionally, this holds true for the confirmation candlestick.
Along with the dependability issue, another shortcoming of the doji pattern is its inability to establish price goals. It is impossible to calculate the return on a transaction made just on the basis of dragonfly doji analysis. Traders must utilize additional technical indicators or patterns to determine the optimal moment to leave.
Key Takeaways
True Dragonflies are extremely unusual, as opening, high, and closing prices are almost never identical.
Successful traders would often wait until the following day to determine whether an uptrend is possible following a Dragonfly.
If the Dragonfly appears following a price increase, it may suggest that a price decrease is imminent.
A Dragonfly with a larger than normal volume is more dependable than one with a little capacity.
Other indications, in addition to the Dragonfly Doji pattern, should be employed to assess probable purchase signals.
What Does a Dragonfly Doji Candlestick Tell?
A dragonfly doji is regarded as an indicator of a possible market reversal. It occurs when a security's open, close, and high prices are almost identical. Thus, a dragonfly doji is T-shaped, lacking an upper tail and only possessing a lengthy bottom tail.
The extended lower tail of a dragonfly doji suggests that the market has been swamped with selling, putting downward pressure on the security's price for a period of time. However, at the end of that period, the closure price might still remain at the open price level. This indicates that buyers in the market are capable of absorbing this amount of selling and bringing the price down.
A dragonfly doji might be a sign of a price reversal. When a security's price has demonstrated a downward tendency, it may indicate an impending price increase. In this instance, it is a bullish dragonfly. If the candlestick immediately following the bullish dragonfly increases in price and closes higher, the price reversal is verified, and trading choices may be taken.
In contrast, if the market has previously shown an upward trend, a dragonfly doji may indicate a price decline, referred to as a bearish dragonfly. Confirmation will come from the subsequent candlestick's downward movement.
Traders can make trading judgments based on a dragonfly doji. They often place orders immediately upon the appearance of the confirmation candlestick. A trader can either long a stop loss below a bullish dragonfly's low or short a stop loss above a bearish dragonfly's high.
Although the dragonfly doji pattern does not appear regularly, when it does, it serves as a warning indicator that the trend may reverse. Following a price increase, the dragonfly's extended bottom shadow indicates that sellers maintained control for at least a portion of the period. While the price ultimately closed unchanged, the period's surge in selling pressure is a warning indicator.
Best Strategies to Use Dragonfly Doji Candlestick
As with all other candlestick patterns, the dragonfly doji should not be employed in isolation. It is most effective when used in conjunction with other technical and price action tactics. You may use indicators such as the Average True Range (ATR) and double moving averages as examples.
Most significantly, it should be used in conjunction with other volume-based indicators, such as the money flow index and the accumulation and distribution indicator. The advantage of employing such volume indicators is that they indicate if the price action is being sustained by substantial volume.
Doji vs. Hammer
As previously stated, the hammer and dragonfly doji patterns are quite similar. Indeed, the two frequently transmit identical signals.
The primary distinction between the two is that the doji opens and closes simultaneously. By contrast, a hammer opens lower and closes somewhat lower than the opening price.
Generally, a dragonfly doji is seen as a more accurate indicator of a reversal.
Doji Gravestone vs. Doji Dragonfly
When the low, open, and close prices are all equal, and the candle has a lengthy upper shadow, this is referred to as a tombstone doji. The gravestone resembles an inverted "T." The tombstone has the same meanings as the dragonfly. Both signal the possibility of a trend reversal but must be verified by the subsequent candle.
Doji with Long Legs vs. Dragonfly Doji
The long-legged doji has lengthy upper and lower tails, indicating significant price volatility over a period of time. It denotes indecision regarding supply and demand in the vicinity of the market equilibrium. The pattern is not always consistent or meaningful.

The Bottom Line
To summarize, the Dragonfly Doji candle is a rather strong bullish reversal pattern. However, it is advised that you utilize it in conjunction with technical indications. They occur when the price opens and closes at the same level, indicating that the market is consolidating. The dragonfly is a critical reversal pattern that you should incorporate into your day trading strategy. Additionally, trading makes sense when this pattern appears at the bottom of downtrends.
On a related note, Dragonfly is the polar opposite of Gravestone Doji, which shares the same characteristics but is mirrored.