Trading the bull flag pattern enables traders to identify market continuations and capture substantial price movements quickly. Usually, it is challenging to enter a fast-moving trade within a market, but the bull flag chart pattern makes it easier to time the market.
The world's finest traders employ a variety of trading tactics. However, the bull flag pattern and its cousin, the bear flag, are one of the most popular. These patterns enable traders to profit from trending markets, comprehend price movements, and execute low-risk trades.
The bull flag pattern is an excellent addition to any forex trader's technical toolkit. The bull flag is frequently connected with explosive moves. This article will examine the bull flag pattern's potential for higher probability forex trading chances.
Bullish flag formations are common in stocks experiencing a solid rally and are regarded as excellent continuation patterns. They are referred to as bull flags due to the pattern's resemblance to a flag on a pole. The pole is the consequence of a stock's vertical climb, whereas the flag results from a period of consolidation. The flag may be a horizontal rectangle or tilted downward in opposition to the prevalent tendency. A bullish pennant is another type in which the consolidation takes the shape of a symmetrical triangle.
The shape of the flag is less significant than the pattern's underlying psychology. Despite a decisive vertical climb, the stock has refused to fall significantly, as bulls buy up any available shares. Breaking free from a flag frequently results in a solid upward move equal to the length of the preceding flag pole. It is critical to remember that these designs are the same in reverse and are referred to as bear flags and pennants. Bull flags generally appear in conjunction with a new market rally.
What Is a Bull Flag Pattern?

Bull flag patterns are technical indicators that indicate a valid entry point into a strong uptrend. Numerous skilled traders employ this continuation pattern to determine the best time to trade the trend.
It is critical to note that the bull flag pattern is ideal for cryptocurrency market conditions, owing to the strong trends that experienced investors can profit from. It is highly effective whether you utilize this flag pattern for day trading or swing trading. Flag patterns are advantageous when trading following a breakout or in a strongly trending market.
In short, the bull flag pattern's primary objective is to assist individuals in participating in the market's present momentum. That means that individuals can use the data it gives to select entry points with a low-risk profile in comparison to the potential gain. From a visual standpoint, this pattern consists of a powerful upward movement (the pole) followed by a flag-shaped consolidation.
How to Spot the Bull Flag Pattern
As previously stated, the bull flag pattern is a continuation pattern. As a result, we are searching for an uptrend - a succession of higher highs and lower lows. The second stage in identifying the bull flag pattern is to keep an eye on the correction's shape.
The chart below illustrates the daily movement of the GBP/USD exchange rate. The flagpole (the ascending blue trend line) denotes the start of an uptrend. Following the formation of a short-term peak, the price movement corrects downward to approximately 50% of the initial increase.

Consolidation takes slightly longer than typical in this instance, but it is not a violent correction lower. Price activity is more sideways but with an overall downward tilt as buyers consolidate their influence. Finally, there is an upside break, which propels the price movement higher.
If you look closely at our example, you will notice a small bull flag, where the breakout of our flag is a flagpole within the mini pattern, and the correction above the top trend line resembles a flag (see chart below). Both are bullish patterns in general, as they help continue the rise.
Different Variations of Bull Flag Pattern
The bull flag motif is available in three forms.
The flat-top breakout pattern is one version. Investors prefer the flat top breakout pattern because there is no discernible reversal in the market trend. The resistance levels continue to rise to the height of the flag pole, forming a horizontal line across the top. The bottom support levels may continue to rise, forming a triangle (sometimes referred to as a 'pennant').
The descending flag pattern is a second version, and this is an actual retraction from the flagpole's peak. While trading may result in a 'W,' this is not always the case. The top and bottom lines of the flag move in lockstep downward until the stock experiences an upside breakthrough. This is the most prevalent variety of the bull flag pattern.
The bull pennant is the third variation on the bull flag motif. Additionally, this pattern results in a flagpole increase in the stock. Rather than the flag's rectangular shape, the pennant condenses the stock into what appears to be a triangle, with the top line falling and the bottom line ascending. This means that the support and resistance levels will converge in a tighter trading window before a breakthrough rather than trading at equal distances.
All three bull flag formations are probable indications that a stock is attempting to break out of a consolidation phase and resume its upward trajectory.
Characteristics of the Bull Flag Pattern
A bull flag pattern typically consists of five components:
The preceding trend: This is the flagpole rise, during which the stock exhibits an uptrend.
Consolidation channel: The range of support and resistance levels within which the stock moves (the flag).
Volume distribution: A jump in volume is frequently observed during stock price consolidation.
The breakout occurs when the stock rises over the flag's resistance levels.
Confirmation occurs when the price continues to rise: Following the breakout, the stock price moves in the same direction as the original flagpole.
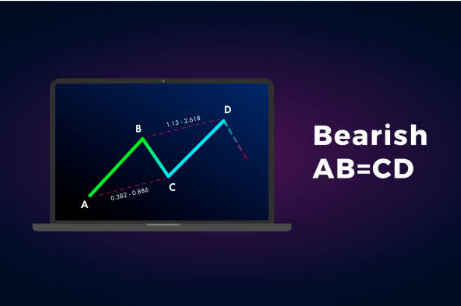
What the Bear Flag Pattern Tells Us
A bullish flag comprises two components: the flagpole and the flag. As such, it has the appearance of a flag on a pole. It is formed when the price action trades in an upward direction, creating higher highs and lower lows. A bull flag is shaped like the letter F, just as a double top pattern resembles the letter "M" and a double bottom pattern resembles the letter "W."
Following the formation of a short-term peak, the price action initiates a downward correction. Unlike the bullish pennant pattern, which uses a wedge or a triangle to consolidate price action, the bullish flag pattern uses two parallel trend lines - a channel - to allow purchasers to regroup before launching a fresh leg higher.
The consolidation phase should not exceed the 50% Fibonacci retracement of the preceding wave higher (the flagpole). A break below 50% indicates that the uptrend is not as powerful as it should be. As a result, a powerful bull flag often requires a pullback of 38.2 percent to 50% before breaking the upper trend line.
After identifying the flag pattern, the entry point should be where the downtrend channel (the structure that frames the flag) loses its downward momentum.
Placing a Protracted Entry
Long entries must be made at the flag's break, while stop-loss orders (risk) should preferably be placed below the consolidation flag. The initial objective should be near the swing high from the previous swing. If the tendency is sufficiently strong, the movement will persist.
Naturally, trade management is not uniform, and the trading style of each trader mainly determines it. Nonetheless, one viable technique is to close a portion of the position at the swing high. Then, using a moving average or trend line, trail the stop-loss order.
Managing Your Trade
Trade management should be conducted following the trader's risk tolerance. The quickest strategy to cash in winnings is to close a portion of the trade near the target area and leave the remainder open.
Alternatively, you can close the position on its whole by projecting the flagpole price range upward. In this instance, the price continues to rise, setting new records.
The sole distinction between a bull flag and a bullish pennant is that the latter frequently takes the shape of a triangle rather than a sequence of support and resistance patterns. When a bullish pennant appears, it typically indicates that the price is about to break out higher.
Flag chart patterns appear to be nearly comparable to pennant patterns. Both are continuation patterns that arise following a sharp and sideways price movement, and they often last between one and three weeks. However, despite the similarities, there are some distinctions.
The pennant pattern is often triangular. It is typically defined by convergent trend lines, which form a trading range when successive highs and lows form a trading range. Due to the steep move up or down, it is consolidated in the pennant shape, with falling resistance and rising support. In general, pennants should be used with other technical indicators to serve as confirmation. Utilizing the relative strength index (RSI) indicator to moderate during the consolidation phase and attain oversold levels.
When a sharp rise (or fall) is followed by trading in a small price range, then by another sharp rise, a flag pattern occurs (or fall). Typically, a flag assists in ensuring that the candle closes above the level of resistance or support (to confirm the price movement).
To be successful in trading flags or pennant chart patterns, it is prudent to constantly use volume as a guide when determining your target price's entry and exit points. That is because it will assist you in confirming breakouts and speculating on the subsequent momentum.
At some point, the patterns may or may not be defined. However, with patience, they will form at the appropriate time.
Bear Flag vs. Bull Flag
The direction of price movement distinguishes a bullish from a bearish flag. The bullish flag strategy is designed to profit from a strong uptrend. Meanwhile, the objective of the bearish flag pattern is to trade short in the direction of the prevailing downturn.
Cryptocurrency enables the identification of bullish and bearish flags. This is because it is a highly volatile market (with directional moves), with opportunities to trade long or short virtually daily, depending on the execution time frame.
Pros and Cons of Using Bull Flag Pattern
The Pros
A bull flag breakout establishes a well-defined price level to initiate a long position, and it establishes a distinct location for the stop-loss order, facilitating effective trade management.
Typically, this pattern generates asymmetric risk-reward scenarios where the possible profit (target) exceeds the risk. It is a pattern that serves as the foundation for a sound risk management system.
In a trending market, the bull flag pattern is a square formation. The steps for identifying the pattern are straightforward.
The Cons
The primary danger associated with the bull flag pattern is the potential for market context misinterpretation. Specific individuals may encounter unfavorable results when performing this pattern because the context is not one of trending markets but rather one of the sideways markets.
To minimize risks and maximize your chances of success, spend time studying multiple bull flag charts to familiarize yourself with their behavior. When the time comes to implement the pattern, it will feel more natural.
FAQs
How does a bull flag appear?
The bull flag begins with a sharp climb (the pole) and ends with a rectangle price chart indicating price consolidation (the flag). Typically, volume increases during the pole phase and drops during the consolidation phase.
What occurs following a bull flag?
If a bull flag is correct, it indicates the continuance of an existing bull trend, and the price will rise after the pattern is complete.
What is the reliability of a bull flag pattern?
Flag patterns are widely regarded as one of the most reliable continuation patterns traders use because they create an opportunity to enter an existing trend that is poised to continue. When flag formations arise, they are all pretty similar and frequently appear in comparable settings within an established trend.
What Is the Distinction Between the Bull Flag and the Bear Flag?
The bull and bear flags are merely mirrored versions of the same chart design.
In contrast to the bull flag, which emerges during an uptrend, the bear flag appears during a downtrend.
Once the price breaks through the lower channel, the bear flag pattern will emerge from the consolidation.
Both bear and bull flag chart patterns predict the target price using the flagpole's length.
Conclusion
Recognizing continuation patterns, such as the bull flag pattern, can assist investors in determining when to enter trades and when to exit holdings. It is an ascending trend followed by a period of trade consolidation.
In summary, the bull flag pattern is quite widespread. It indicates the presence of a strong uptrend, and the flag structure's breakdown provides the optimal entry point to maximize the risk-to-reward ratio. With the bull flag in place, crypto investors who missed the first run-up now have a chance to capitalize on a raging trend. Risk management is required when trading a security, stock, or cryptocurrency. As we should know, no reward is without danger. As long as you have conducted an exhaustive study, you have already taken the first step toward success.